
Optimize your apps performance with Baseline Profiles
Baseline Profiles are a mechanism suggested by Google, capable of increasing code execution speed by roughly 30% from the first launch. It achieves it by skipping interpretation and just-in-time (JIT) compilation steps for included code paths.
To fully understand how Baseline Profiles can improve the app performance, let’s look at how code execution works on various Android versions.
Evolution of Android code execution
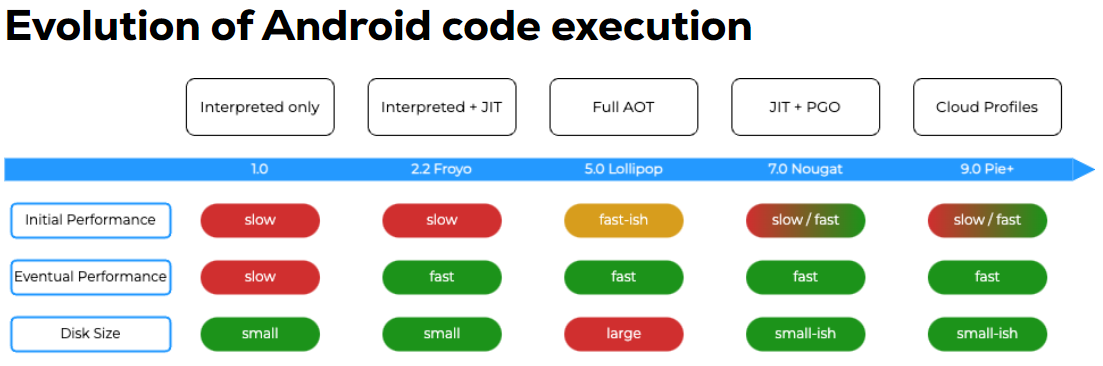
In the earliest Android versions (1.0 – 2.1), the code was interpreted, causing the initial and eventual performance to be slow but allowing to save the disk space.
In Android 2.2, the code started also in interpreted mode, but additionally a just-in-time (JIT) compiler would be looking for hot spots with a view to optimising them. The optimisations, however, got thrown away when the process died, in order to save disk space.
Android 5.0 introduced full ahead-of-time compilation (AOT) using a new dex2oat compiler. This resulted in increased application performance, but also increased the cost of storage, as the compiled code had to be stored on the device. An additional drawback was that every time a new optimisation was introduced, applications had to be recompiled.
Android 7.0 introduced a mechanism called profile-guided optimisation (PGO). With this mechanism, the hot spots were saved in a file called Profile, which were simply a list of classes and methods that could be compiled into machine code. When the device was idle, a background dex2oat compiler precompiled the classes and methods contained in the Profile file. The mechanism allowed to save storage space and increase the overall app performance. However, a few first usages of the app were still slow-ish, as in those cases only the just-in-time compilation was used.
The Android team noticed that many users use the application in a similar way, meaning that the same part of the codebase could be optimised for all the users. So, in Android 9 a technique called Cloud Profiles was introduced – it was an additional form of PGO, where an aggregated Profile file was created and uploaded into Google Play Store, allowing to increase the initial performance. However, every time a new app version was released, the Cloud Profiles had to be recreated, causing a drop in the initial app performance.
Introduction of Baseline Profiles
To solve the slow start problem after a new release, the Android team introduced Baseline Profiles – a form of profile-guided optimization, where the Profile file is generated based on Critical User Journeys (CUJs), which are defined by the developer. This increases the app performance from the first time it is run. Baseline Profiles work on Android version 7.0 and above. Additionally, on Android version 9.0 and above they are applied together with Cloud Profiles, to further optimize the app.
For more information go to: https://developer.android.com/topic/performance/baselineprofiles/overview#compilation-behaviors
Create a new Baseline Profile manually
Baseline profile can be generated with the help of Jetpack Macrobenchmark – a library used for testing larger use-cases of the application, e.g., application startup. With the Profiles generated, you can use ProfileInstaller library to enable local Baseline Profile compilation, which allows benchmarking the app.
Generating Baseline Profiles consists of few steps:
- Set up Macrobenchmark module in your Gradle project.
- Create a new module, using the com.android.test plugin.
- Allow profiling in app-level AndroidManifest.xml.
- Define a new set of ProGuard rules, which disable obfuscation for the Baseline Profile generation (the production app can be obfuscated).
- Define a new buildType, based on the production build, which uses the custom ProGuard rules set. - Define instrumentation test using the Macrobenchmark library, which covers the Critical User Journeys.
- Generate the Baseline Profile.
- Copy the generated file into app>src>main.
- Measure the performance improvement using the Macrobenchmark library.
Baseline profiles can be generated using an emulator, physical device, or Gradle Managed Device. However, to measure real world performance the benchmark should only be run on a physical device, because emulators can provide incorrect result, as they share their resources with the hosting machine.
For more information go to: https://developer.android.com/topic/performance/baselineprofiles/create-baselineprofile#create-new-profile-plugin
Create a new Baseline Profile with AGP 8.2 or higher
Starting with Android Studio Iguana (currently in Canary) and Android Gradle Plugin (AGP) 8.2, there is an easier way to generate Baseline Profiles. The new IDE contains Baseline Profile Generator, which automates the creation of the new module, used to generate and benchmark Baseline Profiles.
For more information visit: https://developer.android.com/topic/performance/baselineprofiles/create-baselineprofile#create-new-profile
Case Study
To test the increase in performance using Baseline Profiles, we applied this mechanism to one of our clients’ projects. The Profile file was generated using a single user journey, which started the app and waited until a given text appears. The journey consisted of three screens – splash screen, data loading screen and a login screen. The screens were written using a mix of Jetpack Compose and Android Views. After the Baseline Profile was generated, the application was benchmarked with a Samsung S21, using the StartupTimingMetric and FrameTimingMetric in 5 iterations.
Using the Baseline Profiles, the value of timeToInitialDisplayMs, which represents the amount of time from when the system receives a launch intent to when it renders the first frame of the destination Activity, decreased by about 22% compared to a run without Baseline Profiles applied. The frameDurationCpuMs, which represents the amount of time the frame takes to be produced, also decreased significantly for all quantiles.
The performance increase was obtained with the most basic configuration. Defining proper and more extensive Critical User Journeys could lead to further performance improvements.
Join Mobile Team

Isn't it great?